Feature
Runway analytics from real operations
See how every runway actually performs: touchdown points, landing and go-around rates, approach speeds, and crosswind, aggregated from real traffic across 47,000+ runways.
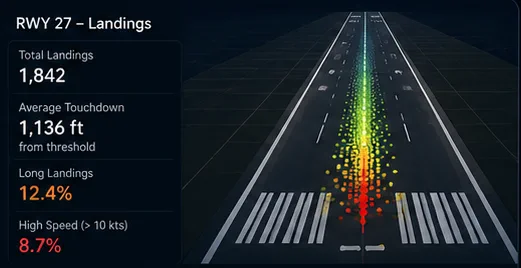
SkyMeter detects the departure and arrival runway for every flight, then rolls thousands of real operations up into analytics you can actually compare: where aircraft touch down, how far into the runway, how fast they cross the threshold, how often approaches go around, and how much crosswind was in play.
It's a picture of how a runway really performs, built not from a survey or a model but from the traffic that actually used it, across more than 47,000 runways and 60,000 airports worldwide.
Why it matters
Touchdown, not guesswork
See where aircraft actually touch down and how long the landings run, aggregated across many real operations.
Compare fields and runways
Per-airport and per-runway stats make it easy to compare workload, approach speeds, and go-around rates across time and place.
Approach stability, scored
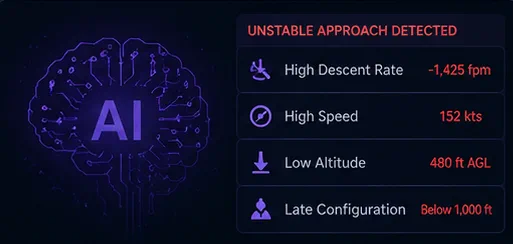
Approaches are scored against published-style gates so you can see how stabilized the traffic into a runway really is.
What you get
- Automatic departure and arrival runway detection
- Touchdown-point and long-landing distribution
- Approach-stability scoring against published-style gates
- Threshold and approach speed statistics
- Crosswind, headwind, and rollout-length metrics
- Per-airport and per-runway go-around rates over time
How it works
For each flight SkyMeter identifies the runway, measures the touchdown and rollout geometry, and scores the approach, then aggregates those per-flight measurements into per-runway and per-airport statistics.
How the approach score and its gates are defined is documented on the approach-score methodology page, linked below.
How the approach score worksWho it's for
Operations & safety teams
Benchmark approach stability and go-around rates across runways and seasons.
Researchers
Study touchdown-point and long-landing distributions at a field with real data.
Pilots & planners
Understand the typical approach speeds, crosswind, and rollout at a runway before you fly it.
Frequently asked questions
Where do the runway metrics come from?
From real reconstructed ADS-B operations. SkyMeter detects each flight's runway and touchdown geometry and aggregates thousands of them per runway. Nothing is modeled or surveyed.
How many runways are covered?
More than 47,000 runways across over 60,000 airports worldwide, with statistics that grow as new traffic is processed.
What is approach-stability scoring?
Each approach is scored against published-style gates for speed, descent rate, and deviation. The full definition is on the approach-score methodology page.
Can I see metrics for a specific runway?
Yes. Every airport and runway has its own analytics profile, reachable from the airports directory.
Explore more capabilities
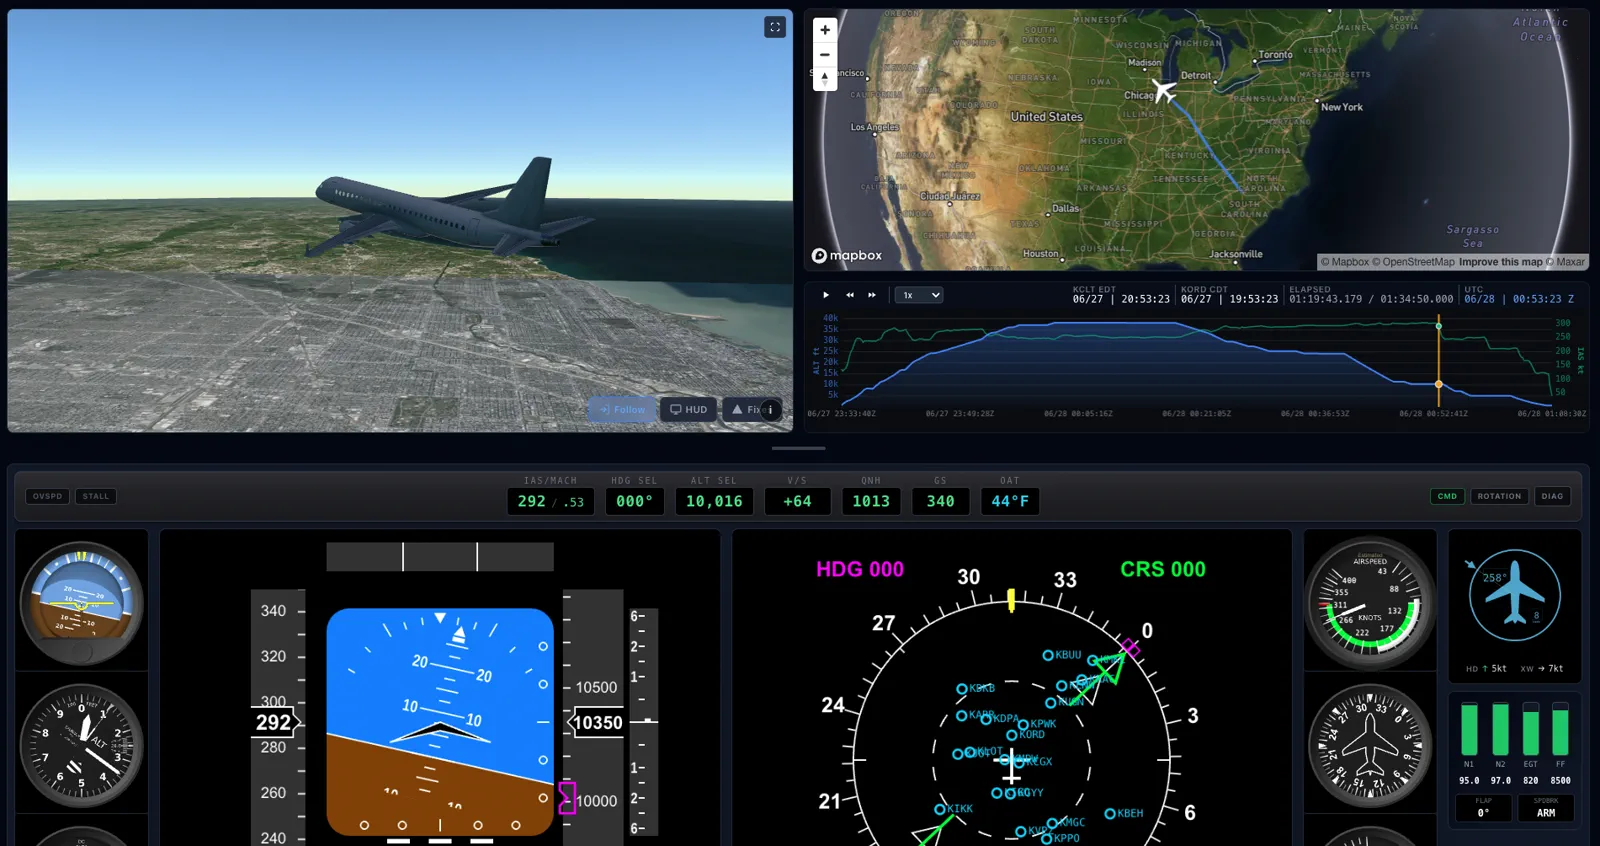

Ready to see it on a real flight?
Start free with the last 7 days, or unlock the full archive and exports with Pro.